Motivation
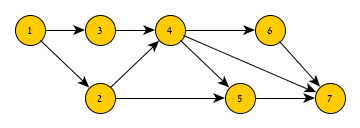
Representing the dependency tree of activities within a project is better done with arrow diagrams compared to node diagrams (Which is how MS-Project draws them). The difference is that in a node diagram every node is an activity and an edge is a dependency. With arrow diagrams, the activity is the edge and nodes represent events (like the start/end events of the activities).
Here is an example of a node diagram representing dependencies between activities:

Here is the same dependencies expressed as an arrow diagram:

Note how the activities are now edges, and nodes are there to capture the dependency. The dashed edges are not activities but rather a way to express dependencies where edges are ought to be split (but of course they cannot).
Working on arrow diagrams for some projects, I got the hang of building them rather quickly. I always started at building the node diagram first since that was straight forward and only then converted them to arrow diagrams having some understanding of the network. Eventually, I came across a project which was too hard for me to produce a diagram for.
So, I figured, letting a machine do it would be interesting.
A Tool To The Rescue
I eventually enjoyed some exploration of Graph Theory and graphing tools (you could read more about it here) leading me to building a library to produce those diagrams from CSV or MS Project files. The diagrams are output to a GraphViz DOT files or yEd Graph Editor GraphML files.
There is also a small sample command line application using that library to produce the results. I use that to get an initial arrow diagram which I later layout, improve, and format (using the tools above) to get it to be as good as I need it to be.
Finally, I could see how my nemesis, the project which triggered this work looked like:

You can find the project on GitHub or if you only care about the algorithm used I explain it in more detail in the wiki page of that project.
Feel free to fork, post issues or PR’s if you want to contribute and find this tool useful.
Fun Stuff
Producing yEd Specific GraphML
In order to create the yEd Diagrams from .Net I had to generate a variant of GraphML which includes yEd specific description of the visual style of the graph elements. This was done by extracting the XSD of a sample GraphML file produced by yEd (it’s an XML file). Converting that using the xsd.exe tool bundled with Visual Studio to XMl serializable classes. (With many bugs in the output manually fixed). All and all, it works, and it was fun! (Pain). Checkout the model for the GraphML Writer module in the source code.
Transitive Reduction
Unfortunately, the Graph library I worked with (QuickGraph) did not contain a Transitive Reduction algorithm so I built one myself by porting some Matlab code and adding some of my own.
Reading MS Project Files using .Net
I don’t get why Microsoft hides the SDK for MS Project in recent documentation. I couldn’t find it, anyway, and I did not want to write VBA add-in to export the data. (You can’t have all the fun in the world, right?). Luckily I stumbled upon the MPXJ which is a Java based open source project that can work with various project management tools including MS Project. It has a weird .Net binding API but it works.
IDesign
It is noteworthy that I learned about the benefits of those diagrams in the context of project design from the great IDesign classes I have attended and the IDesign architect classes’ Alumni newsletter. You can read more about my experience with IDesign here