Why Graphs?
Lately I have been working on a problem related to network representation of activity dependencies of a project. The obvious computer model of such a network is a Graph. In the past I worked on other problems who at first inspection where not a natural candidate for a Graph representation but my solution benefited a lot from using them.
In this post I want to share some of the tools I use when working with graphs, specifically when I use .Net, and also to make that model a little bit more familiar so it could pop-up more often while thinking of ways to solve problems.
But Graphs?!
Oh Wait, if, when you read Graph you imagine this:
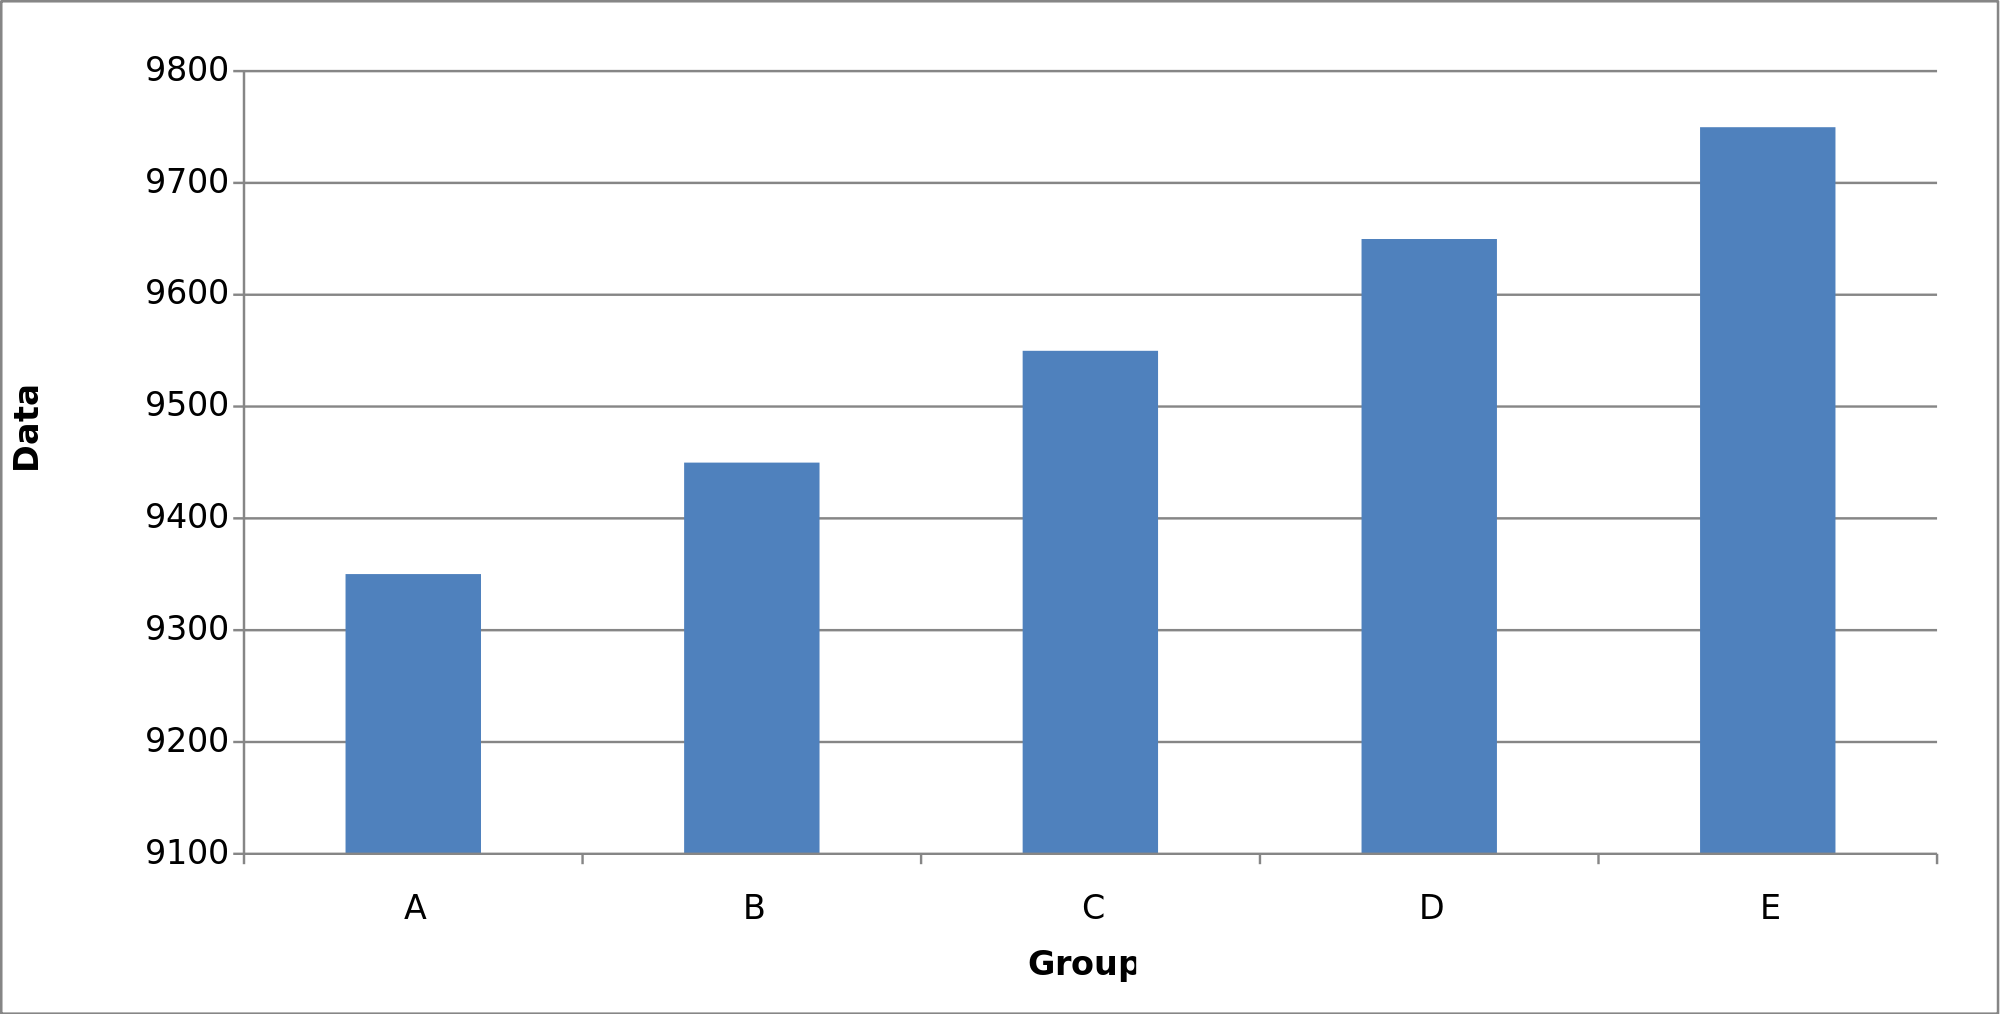
You should probably imagine something like this:
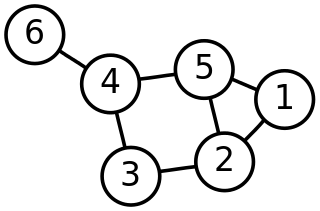
You can read more about Graphs and Graph Theory to get things straight.
Also, don’t feel bad for the confusion, the image above is actually from the first google search result for “graph”. Irony is, even they got it wrong.
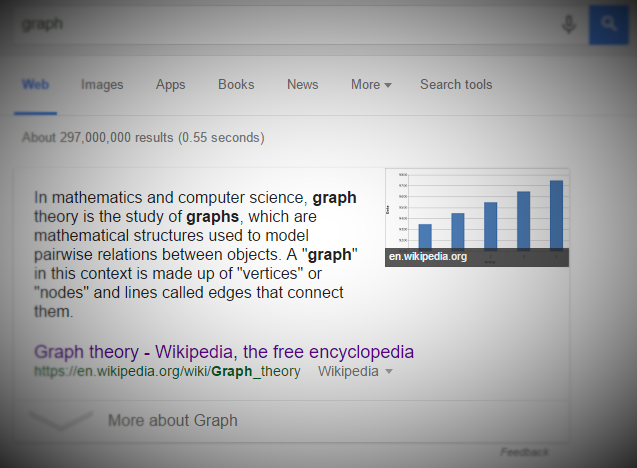
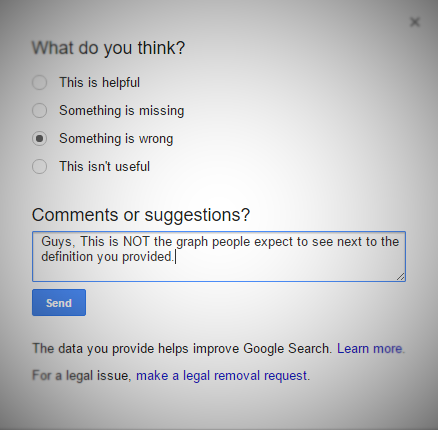
Clearly some schmoe had to give them a negative feedback on that. It just so happens it was me.
The Basics
Don’t Worry! I would only cover the really basic basics here as this is not the focus of this blog post.
Generally speaking, graphs are made of Nodes (or Vertices) and Edges. Edges connect two Nodes, and Nodes could be connected to any number of Nodes (or none) using Edges. The interesting aspects of graphs come from the interconnections and the indirect connections of the nodes using the edges. This concept is very powerful in representing relationships between entities or concepts and has a very large body of knowledge around representation types, data structures, algorithms to work with graphs and so on.
Graphs are a big family, in it, many types of graphs live. The types are defined by their characteristics such as if an edge has a direction defined or not, if any node can reach any other node or if a node could have a loop (cycle) pointing back to itself. Some of these Graph types are so useful they have their own names. For example, “Trees” which are Graphs with undirected edges, where all nodes can be reached directly or indirectly from any node and in only one way (one path passing through the edges).
Since in computer science, networks can be found in abundance as a popular metaphor to complex systems, Graph Theory is right there to help answer many questions about those networks. (Don’t think just about a computer network, think web page links, social network service, assembly references dependency etc.)
The questions you might want to ask could be as simple as “Is there a connection between Node X from Node Y?” or more complex like “Could Every Node in the Graph can be reached from Node X in less them 4 hops?”
Also, you could perform some operations on a graph to understand something about it, for example, cluster some of the nodes depending on their connectivity to other nodes to find groups of nodes of some kind.
Data Structures
Once you see your problem as a Graph problem, you could choose to implement your own data structure to represent and work with that graph. How hard can it be? A list of nodes, A list of edges connecting some of the nodes, and you’re done.
Not so fast… Depending on the usage of the graph, the amount of edges compared to the amount of nodes, its size in general, the algorithms you intend to run on it and the operations you want to perform - different data structures could be more suitable than others. For example, why not represent the graph as a Boolean matrix where each row is a node and each column is a node and a true marks a (directed) edge? After all, it captures all the data in the graph right?
Memory and Time complexity are key to figure out what data structure would best fit your needs. Sometimes you would use multiple data structures on different parts of the system to represent the same graph just because you work differently on it.
Algorithms
Without going into too much detail, working with graphs could get really complex really fast, depending on the problem you confront. Rarely will you have to come up with an algorithm to do/answer something that is not already known and proven to be true. (As well as analyzed and optimized in terms of memory and time complexity). If you do, though, this blog post is probably far from enough for you anyway.
I suggest dusting some of the computer science classes you took back then and getting familiar with the common algorithms. In times of need I also find the reference manuals of different graph libraries to be a good directory of suitable algorithms.
Tools
When working with graphs you might want to do any of the following:
- Query & Mutate Using Algorithms
- Serialize / Deserialize
- Visualize
Then I urge you to invest time in choosing the tools that would help you do it. Any coding work you will do is potentially a great waste of time and usually produces inferior results. (Trust me, I have been there).
I would like to describe some of the tools I use when working with graphs in and .Net
Data Structures & Algorithms
QuickGraph
I have been using QuickGraph for many years now, and it’s great. Really.
QuickGraph gives you an open-source .Net implementation of data structures and algorithms as well as some basic serialization/deserialization support for graphs and a somewhat non-usable visualization capabilities. The algorithms library is quite comprehensive and only once I found it lacking something I needed. The data structures are versatile and cover the usual use-cases you might come across.
Two major pain points with QuickGraph are the poor documentation and the project status. Documentation is basic, in some parts it’s missing and other parts it’s plain wrong (Most times when the API changed but the docs did not). I often find myself reading the source of the library to figure things out and make sense of things. You should expect to do just that beyond any simple toy application you will produce.
This is also related to the next problem, maintenance. The project is currently at version 3.6 and has not been updated since mid-2011. As grateful as I am to the main author of this library Jonathan ‘Peli’ de Halleux I feel sad seeing such a useful project dead. I wish I could contribute to it more. (And I might)
Still, I could not find a good replacement yet, and QuickGraph saved me time and again from the pains of implementing the underlying stuff which my business has no interest investing in.
Finally, I recently spotted this fork on GitHub which ported some of the code to F# and seems determined to bring this project alive. I sure hope so.
(De) Serialization
When you want to store a graph or pass it into another application for further work you need to be able to (de)serialize it. There are multiple formats which are common, any one of them has it’s own cons and pros. They could be as simple as a csv file with a list of nodes and edges or a complex XML documents which gives a great flexibility in describing not only the graph but also changes to it across times, visualization, nodes and edges metadata and more.
File Formats
When working with flat file or byte-streams some common file formats exist.
You should be aware that serializing a graph without any visualization information (and calculating a layout for it) is useful to process that graph in other applications but usually is not useful for human interaction. See more below about layout generation and visualization tools.
QuickGraph itself supports basic serialization to GraphML which is an old but very common format. Unfortunately, I needed other formats supported so I coded up some of them myself. (I intend on posting more about that in the future).
If you do code up your own serialization, take a look at those formats and see if you can find libraries outside of QuickGraph to do it for you. This list is from the website of the tool Gephi which I discuss some more below.
I especially like GEXF which is much like GraphML (probably even based on it) but more modern and with better standards for advanced usages.
Graph DBs
I have no experience with using Graph DBs. I did represent graph data in standard relational DBs in the past though so it’s definitely possible.
A Graph DB basically treats the nodes (entities) and the edges (relationships) as records, or values. Contrast that with a relational DB where the relationships are implicit between the tables. This approach allows a more natural and performant processing of graph data, and where graph data is the core domain data taking on the complexity of another tool starts to make sense.
Since I have no experience with Graph DBs - I cannot recommend any of them, but do know they are out there.
Visualization
I find visualization of graphs (and visualization in general) very important. A single glance at a graph diagram tells me much more than hours of inspecting lists of edges. For that reason I always try to find ways of looking at the graphs I work on. So far I came up and worked with serveral reasonable tools to do that. Note also that I refer below to tools which generate graph diagrams, there could be other visual ways of representing a Graph (For example a distance-chart)
yEd Graph Editor
Oh man, this free tool is amazing. I used it in the past to produce UML diagrams and though it sucked (I thought of it as a poor man’s MS Visio). Lately, I rediscovered it as visualization genius with a smart and versatile layout engine and great editing tools which allowed me to learn more and faster about my graphs.
Problem is, it’s variant of the GraphML format used to store the graphs with all that richness is proprietary and so does the .Net library to work with it (costs). That gave me some hard time when I wanted to visualize graphs I work on using code.
I may have overlooked some legals here but I reverse-engineered the parts I needed and wrote my own serializer to export yEd compatible GraphML files for a specific usage scenario. It would be available as part of a small open-source project I worked on solving a network diagramming problem.(More on that in a future post)
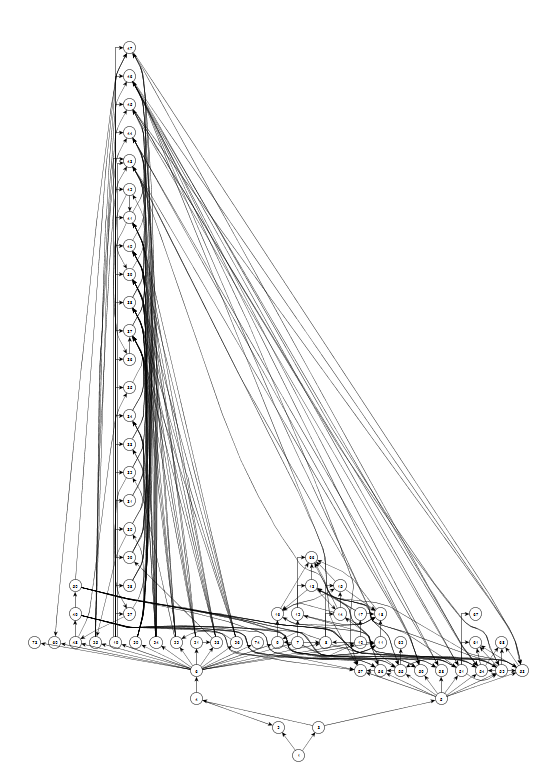 This is a layout generated by yEd for one of my activity-dependency graphs, am I the only one seeing a sailboat here?
GraphViz
This veteran toolset is open-source and commonly used to produce visualization of graphs in many academic circles. It has binaries for every platform as far as I know. IT operates on the DOT language scripts which is another format you could use to describe graphs.
There are .Net libraries to produce DOT files and also other libraries that wrap around the GraphViz tools.
GraphViz can create layouts and diagrams and export them as images, SVG and other common formats.
Also check out this toy which is a port of GraphViz to Javascript running in the browser producing SVG output. cool.
Microsoft Automatic Graph Layout
I did not use that tool but it seems like a basic version of GraphViz but less alien to the Windows/.Net ecosystem.
Gephi
It is not fair to put Gephi (free open-source and java based) on the visualization category since it does so much more. But for the purpose of this post it has a powerful visualization engine especially suited for analyzing and working with massive graphs. (Think The Internet).
If you are serious about Graphs and want to do research in that area you should know about Gephi and its rich plugin eco-system.
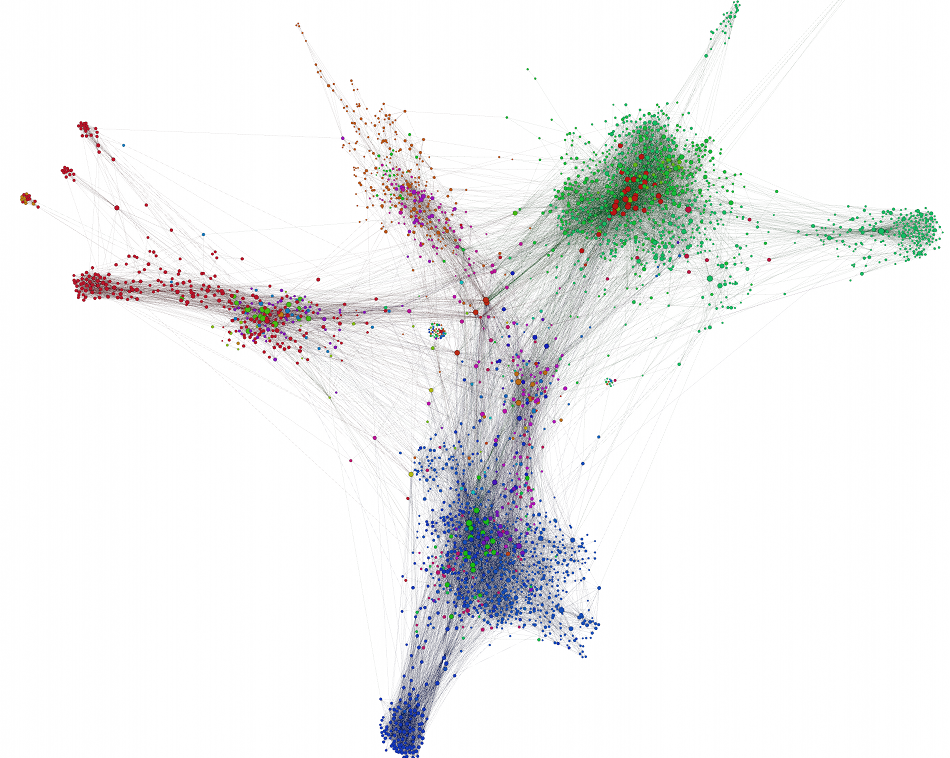 Sometimes graph diagrams are such a work of art!
Visual Studio Debugger Support
Often overlooked, visualizing Nodes and Edges during debug sessions can be extremely useful. I took QuickGraph’s approach and annotated my Node/Edge classes with DebuggerDisplayAttribute. I am sure it is possible to implement an even better visualization for graphs while in the visual studio environment. Who knows, maybe I’ll do it someday.
Summary
In this post I did not give any code examples or reference implementation since I think those are beside the point. On your daily though process you should consider Graphs as a valid model for your problems when it’s a good fit. Do not try to invent anything since most things are already available and for free. Humans can process large amounts of data when it’s presented in a good visual manner, and for some data sets Graph Diagrams are a natural fit.
An interesting read on networks in our life and the science behind them is the book Linked: The New Science of Networks.

The book is a bit dated (published 2002) but tells a great story on the research and thought process leading to the understanding of what makes real-life networks behave they way they are. In a world of ever increasing conenctivity and globalization, the mechanics of networks are observed everywhere and could be useful when analyzing your next problem domain.